Impact Dashboard
Gain a comprehensive view of your data in Reo.Dev assessing the impact of Reo.Dev on your GTM strategy.
Let's understand the components of the Impact Dashboard.
Dev Funnel
Segment Analytics
CRM Analytics
Team Analytics
Dev Funnel Analytics
Dev Funnel: The developer funnel graph provides an overview of the number of accounts in each stage of the developer buying journey.
Exploring: Developers are discovering your product
Evaluating: Developers are assessing your product
Building POC: POCs are being created to test use cases
Deployed: The product is actively in use
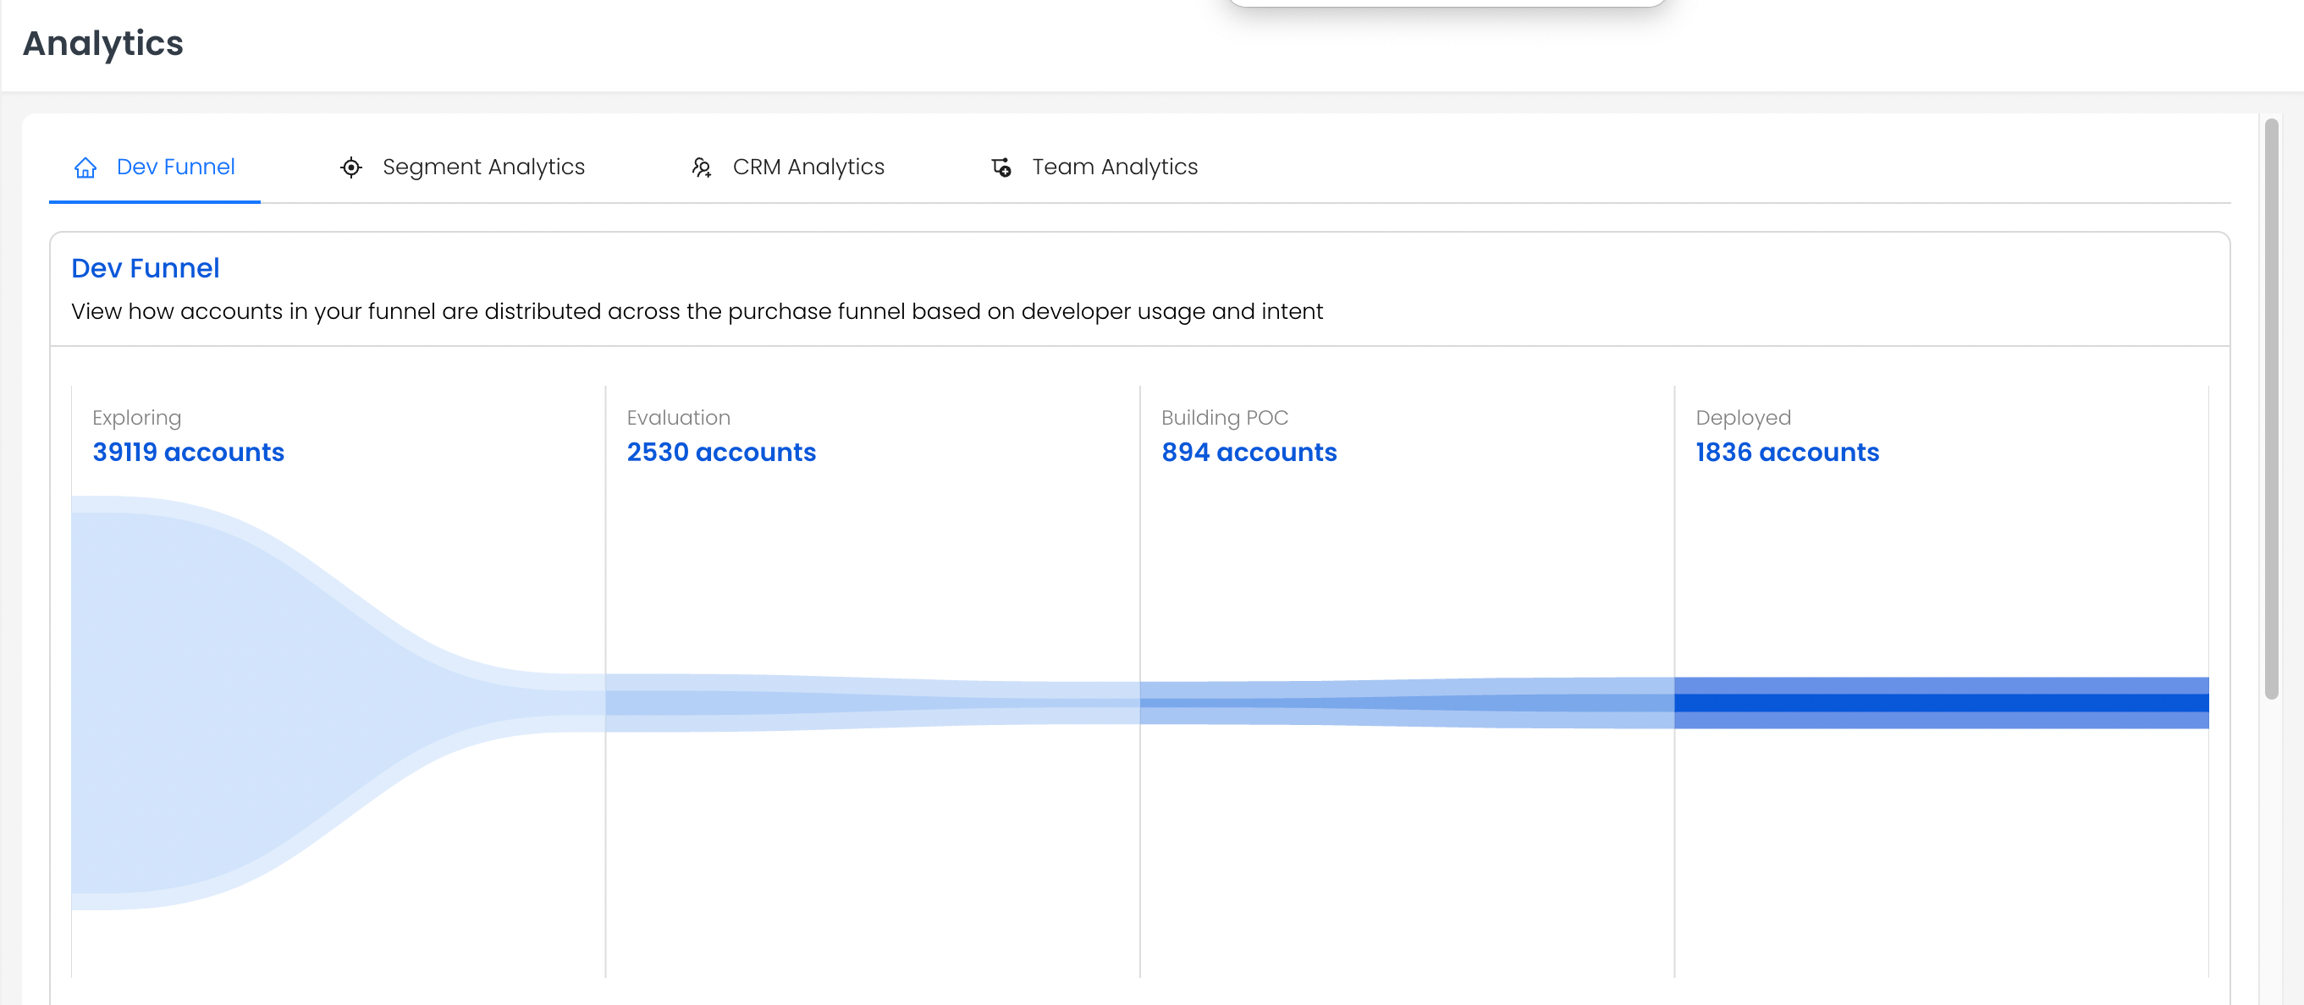
You can click on each funnel stage to view the list of accounts in that stage.

2. Change in Dev Funnel: This graph gives an insight into how accounts have moved across the Dev funnel in a given timeframe. e.g You can get the list of accounts that have transitioned from Exploring Stage to Building POC in the Last 30 Days.

Segment Analytics
1. Segments: This section will give you a comprehensive view of the total segments created for a specific timeframe.

2. Segments created by Users: Here you'll find the count of segments created by team mates.

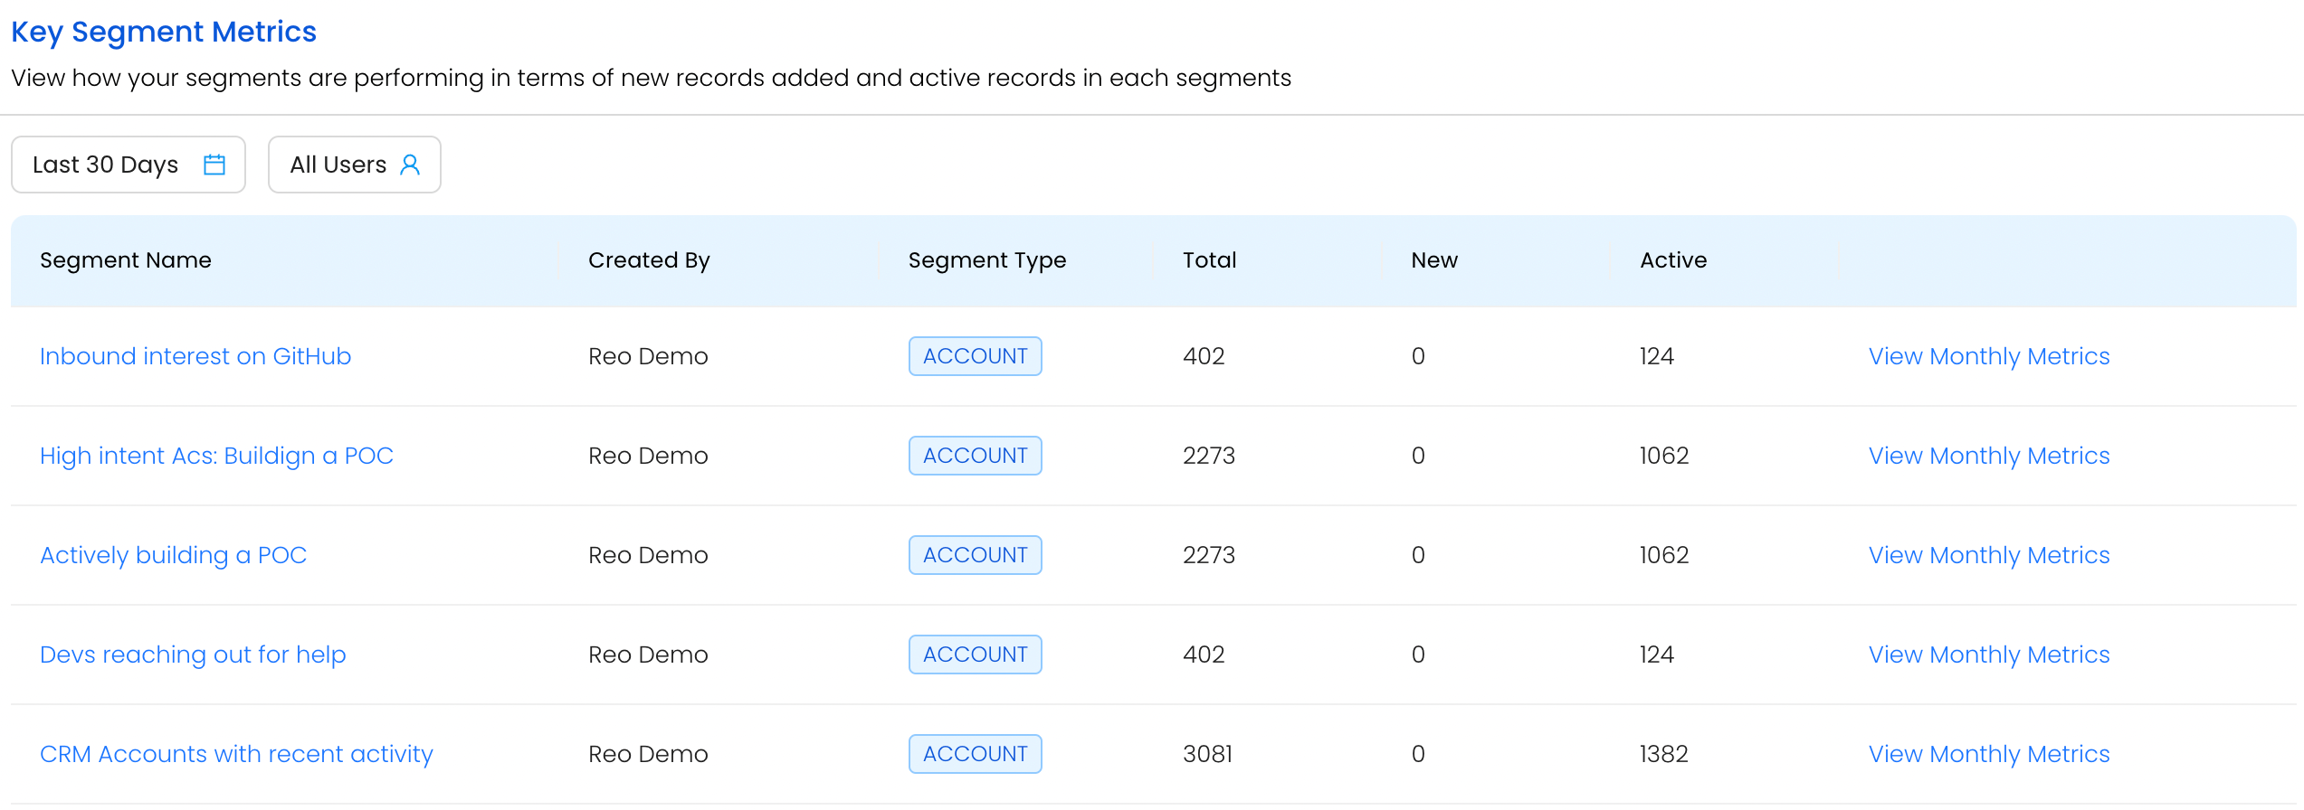
3. Key Segment Metrics: On clicking View Monthly Metrics against a segment, you'll get the following information:
Total: Count of Accounts / Developers in the segment
New: Count of New Accounts / Developers in the Segment
Active: Count of Accounts / Developers Active in the Segment
CRM Analytics
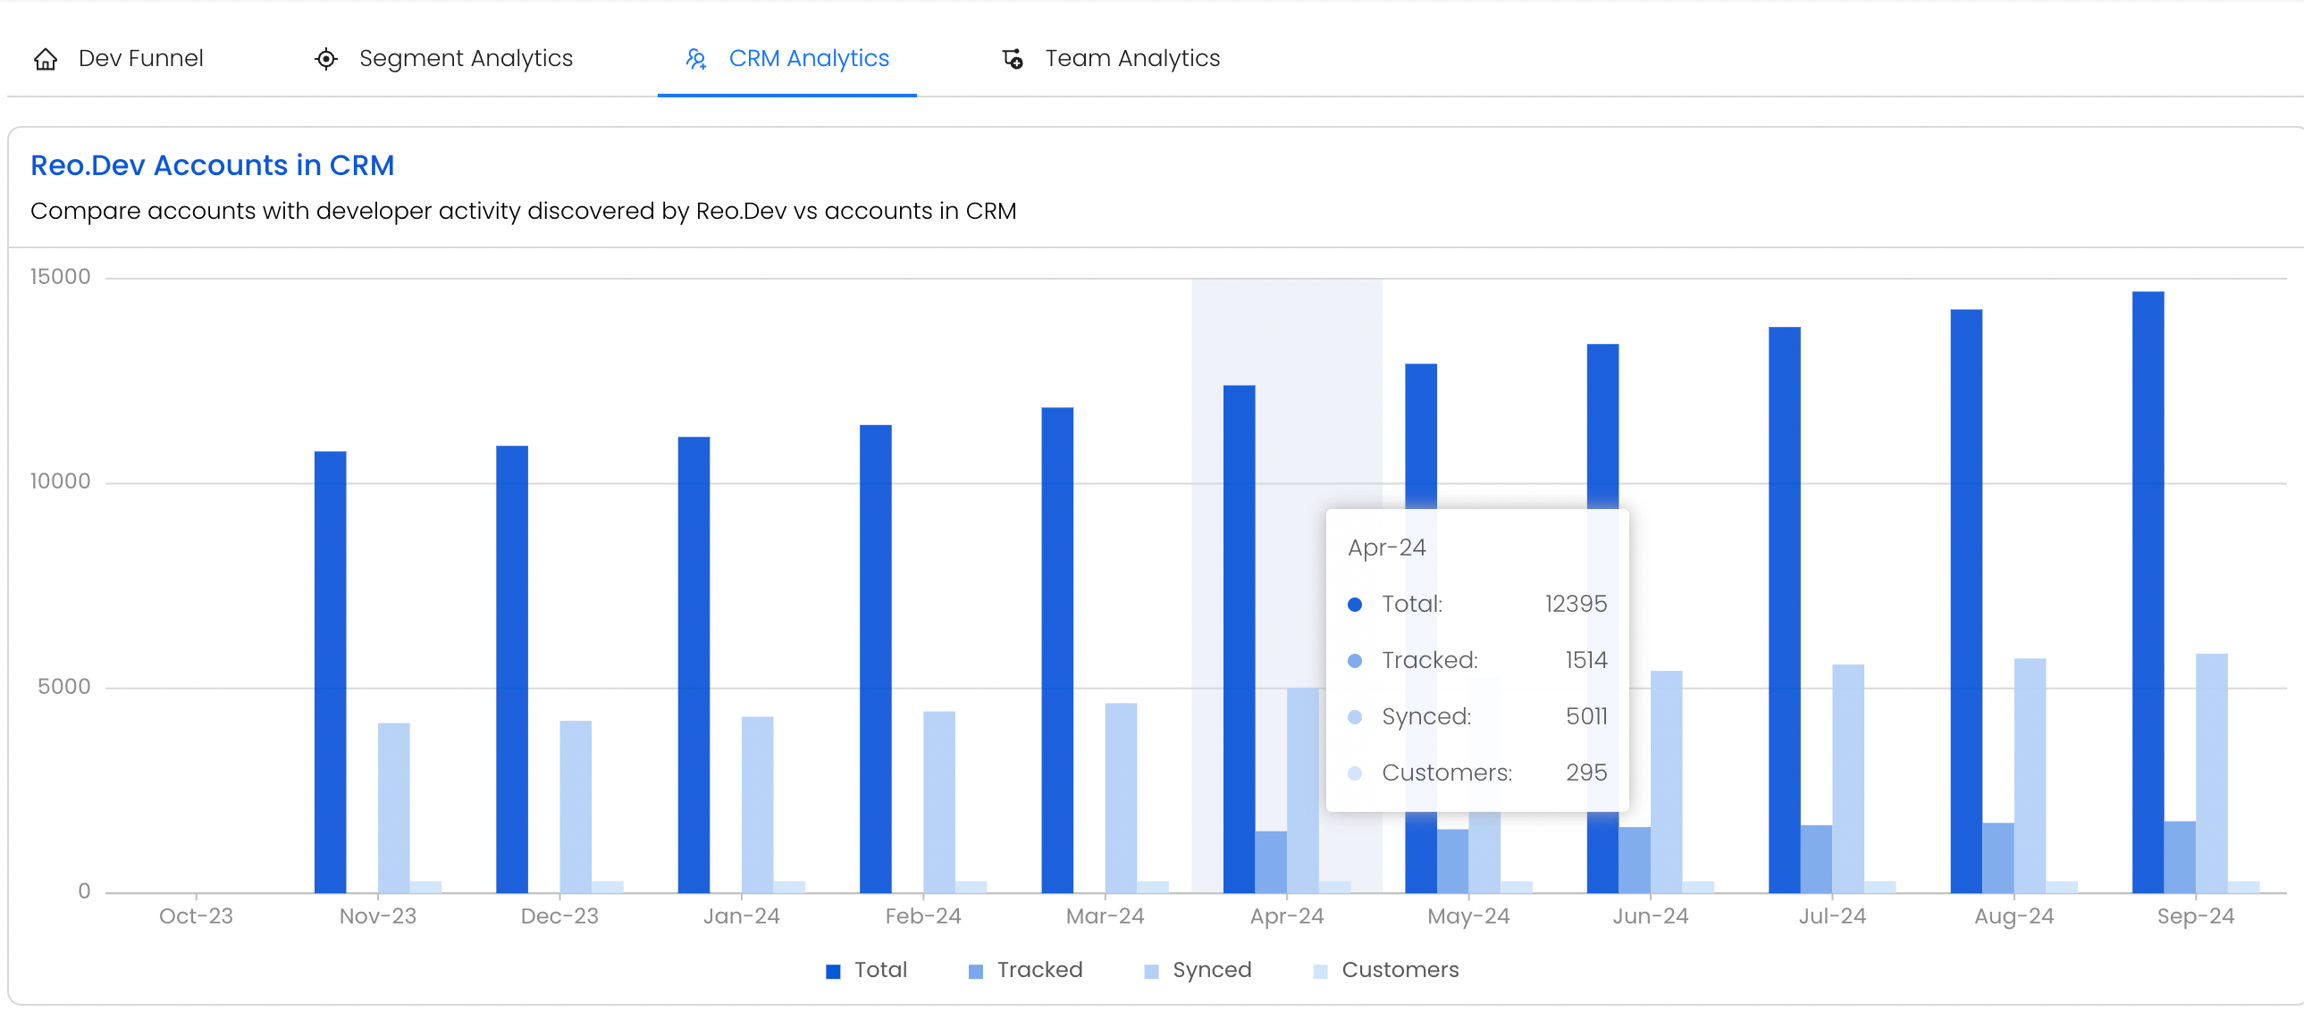
1. Reo.Dev Accounts in CRM: This graph provides insight into how many accounts in have recorded developer activities as captured by Reo.Dev
Total: Count of Accounts in CRM
Tracked: Count of Accounts in CRM tracked by Reo.Dev
Syned: Count of Accounts synced from Reo.Dev to CRM
Customer: Count of Accounts marked as Customer in CRM
How does Reo.Dev get this data?
Reo.Dev gets the data from CRM using the two-way integration.
From the For any account where developer activity is being tracked by Reo.Dev, we fetch the company data to find out lifecycle stage of the company in CRM.
This data is used to calculate the Stage field in Reo.Dev and displayed in the Account list to highlight if the Account is in CRM or not. We also mark the account as Customer to help the user to segregate the accounts and prioritise accordingly
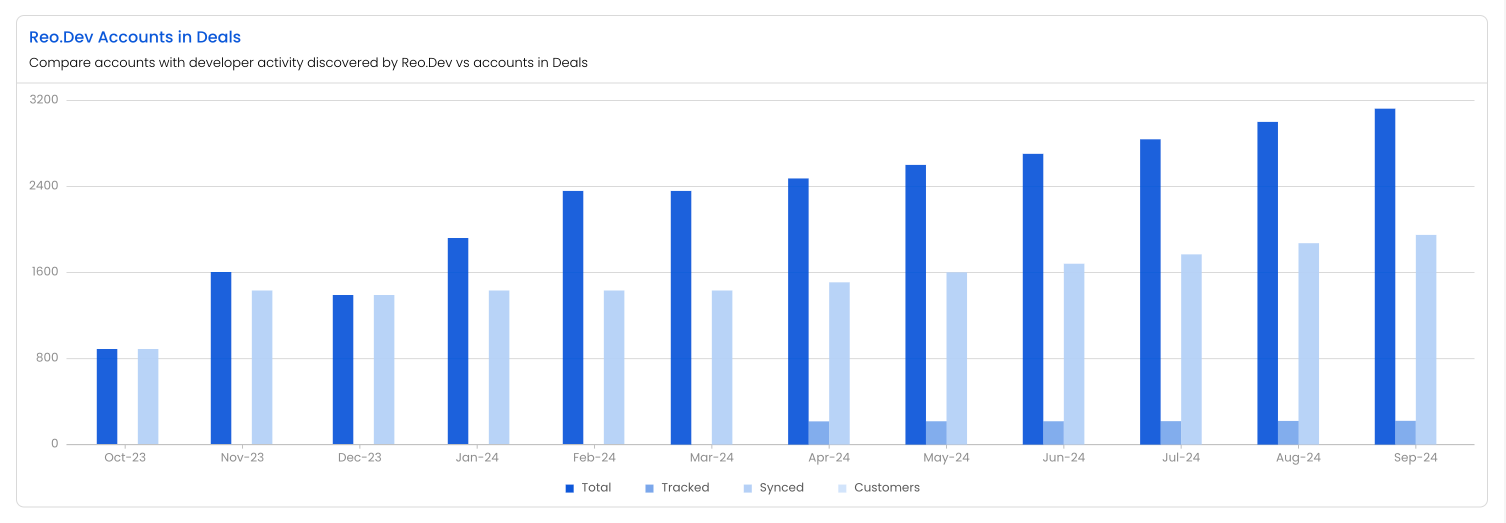
Reo.Dev accounts in Deals: In this section, you can compare accounts with developer activity discovered by Reo.Dev vs accounts in Deals. Metrics tracked:
Total: Count of Accounts in Deals / Opportunities
Tracked: Count of Accounts in Deals / Opportunities tracked by Reo.Dev
Synced: Count of Accounts in Deals / Opportunities synced from Reo.Dev to CRM
Customer: Count of Accounts Deals / Opportunities marked as Customer in CRM
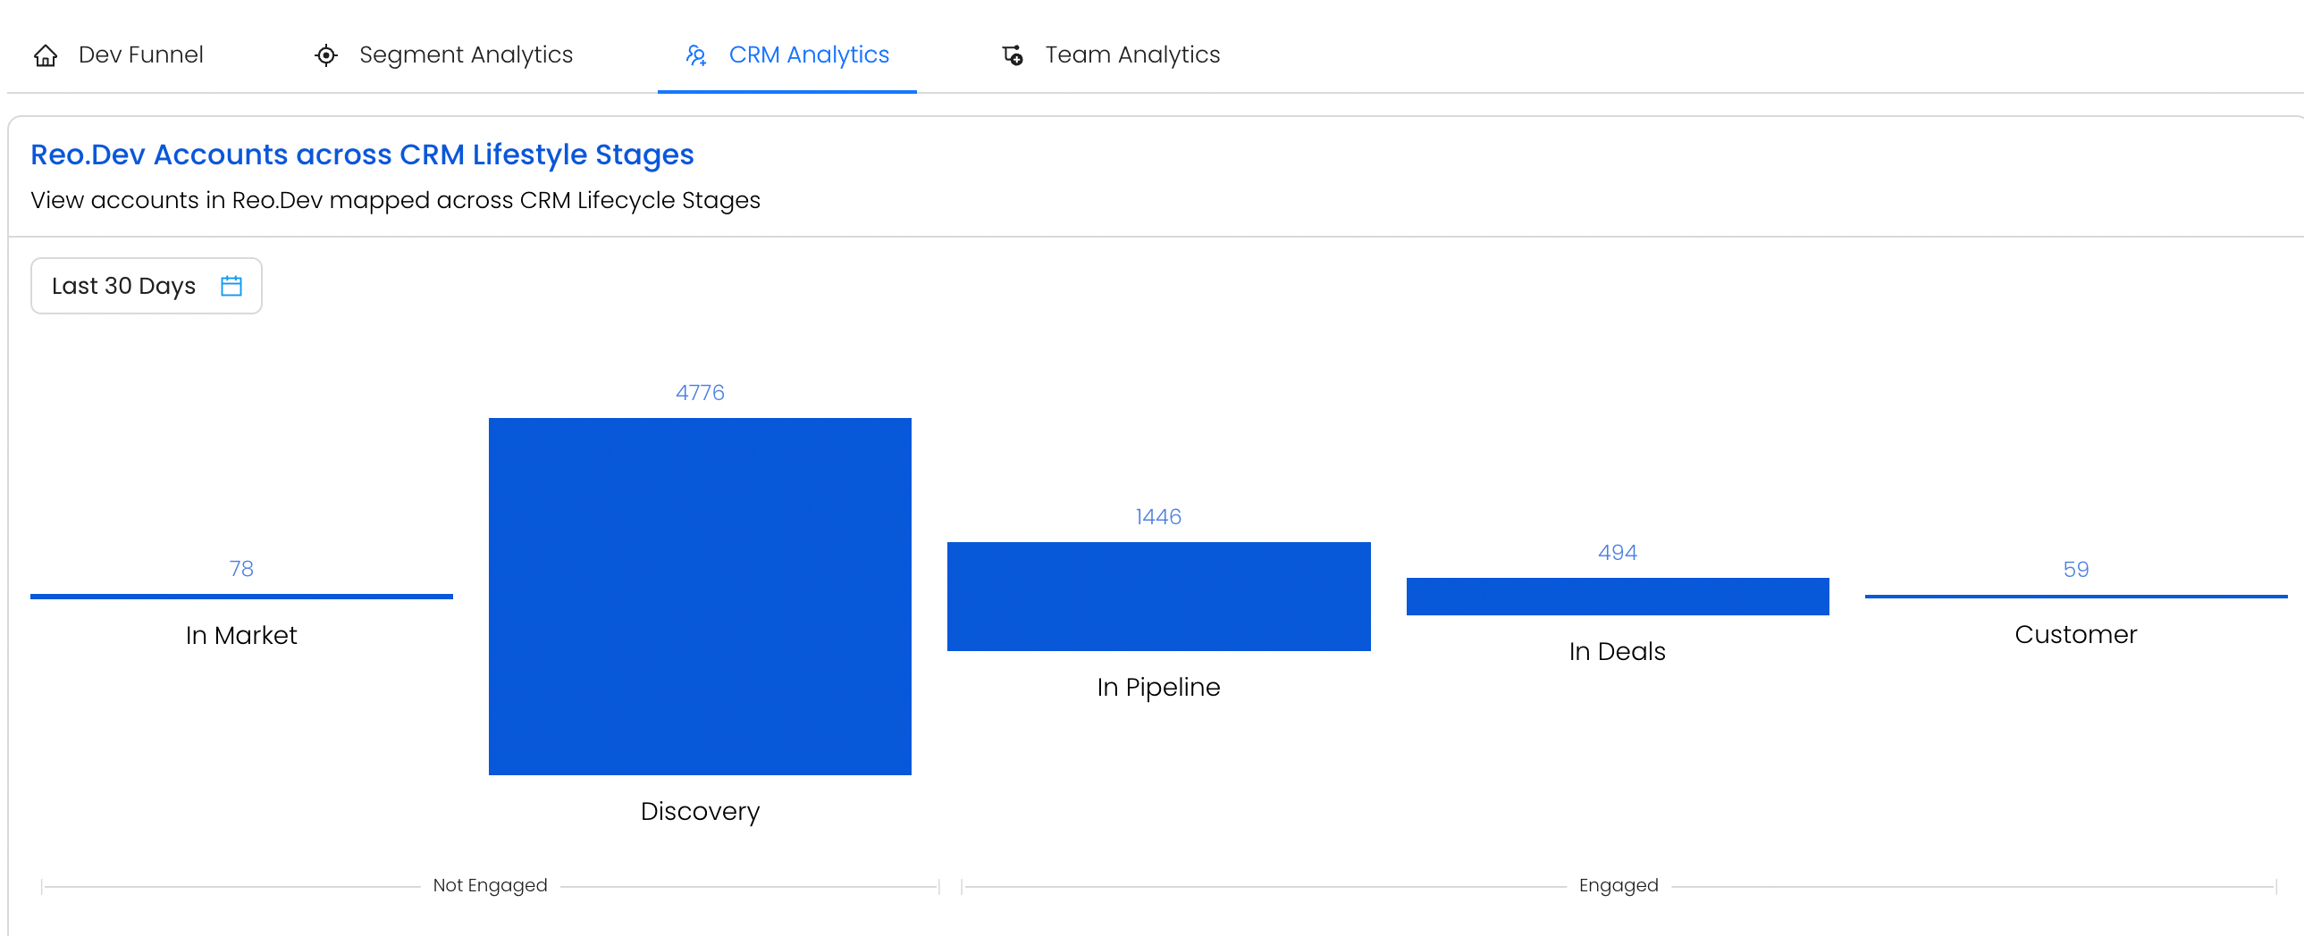
Reo.Dev Accounts across CRM Lifestyle Stages: Here you can view accounts in Reo.Dev mapped across CRM Lifecycle Stages:
Stages of the account in the pipeline:
In Market: Accounts not yet engaged with you and not in your CRM
Discovery: Accounts engaged with you but not yet in your CRM
In Pipeline: Accounts at various stages within your CRM
In Deals: Accounts present in Deals / Opportunities stage in your CRM
Customer: Accounts marked as customers in your CRM
How does Reo.Dev get this data?
Reo.Dev gets the data from CRM using the two-way integration. For any account where developer activity is being tracked by Reo.Dev, we fetch the company data to find out lifecycle stage of the company in CRM.
This data is used to calculate the Stage field in Reo.Dev and displayed in the Account list to highlight if the Account is in CRM or not.
We also mark the account as Customer to help the user to segregate the accounts and prioritize accordingly
4. Change in CRM Lifecycle Stages: This section gives an insight into how accounts have moved across the Lifecycle in a given timeframe. For, example, you can get the list of accounts that have transitioned from In Market to In Pipeline stage in the Last 30 Days.

Team Analytics
1. Total Team Members: Total count of members from your organisation using Reo.Dev.

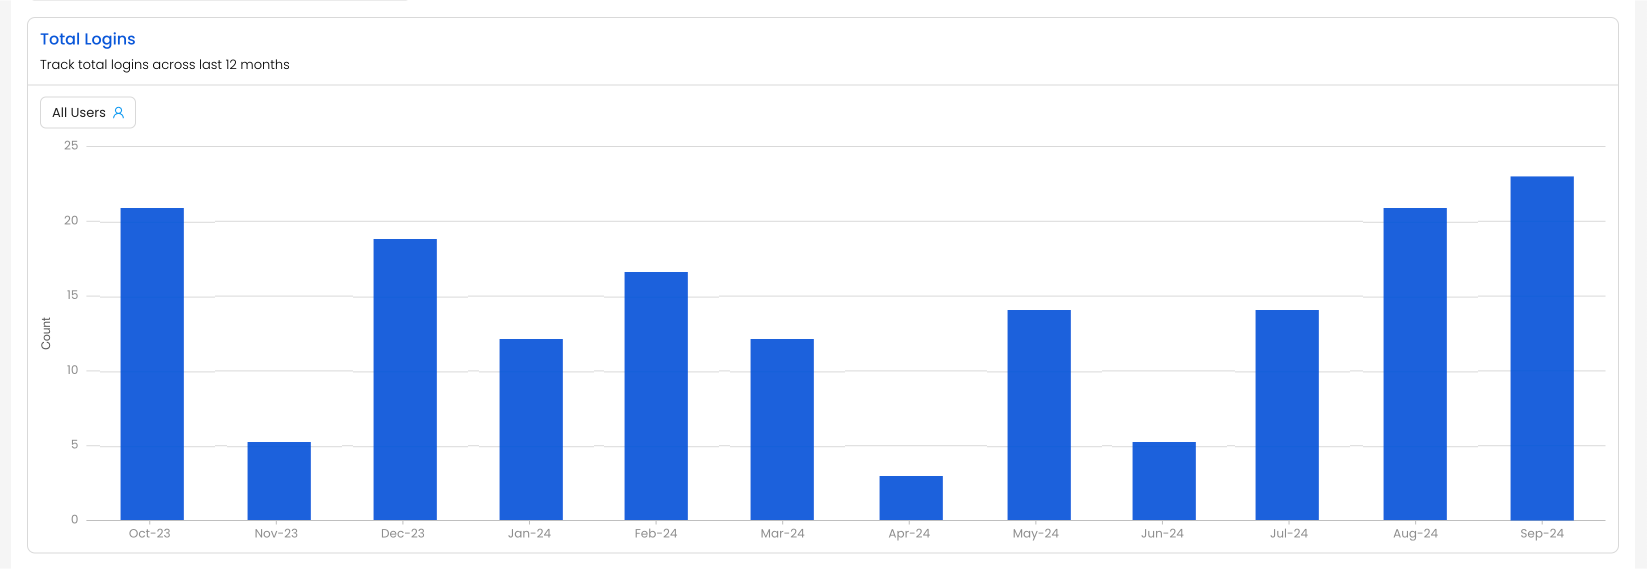
2. Total Logins: This section displays the total logins over the past 12 months, either for individual users or all users combined.
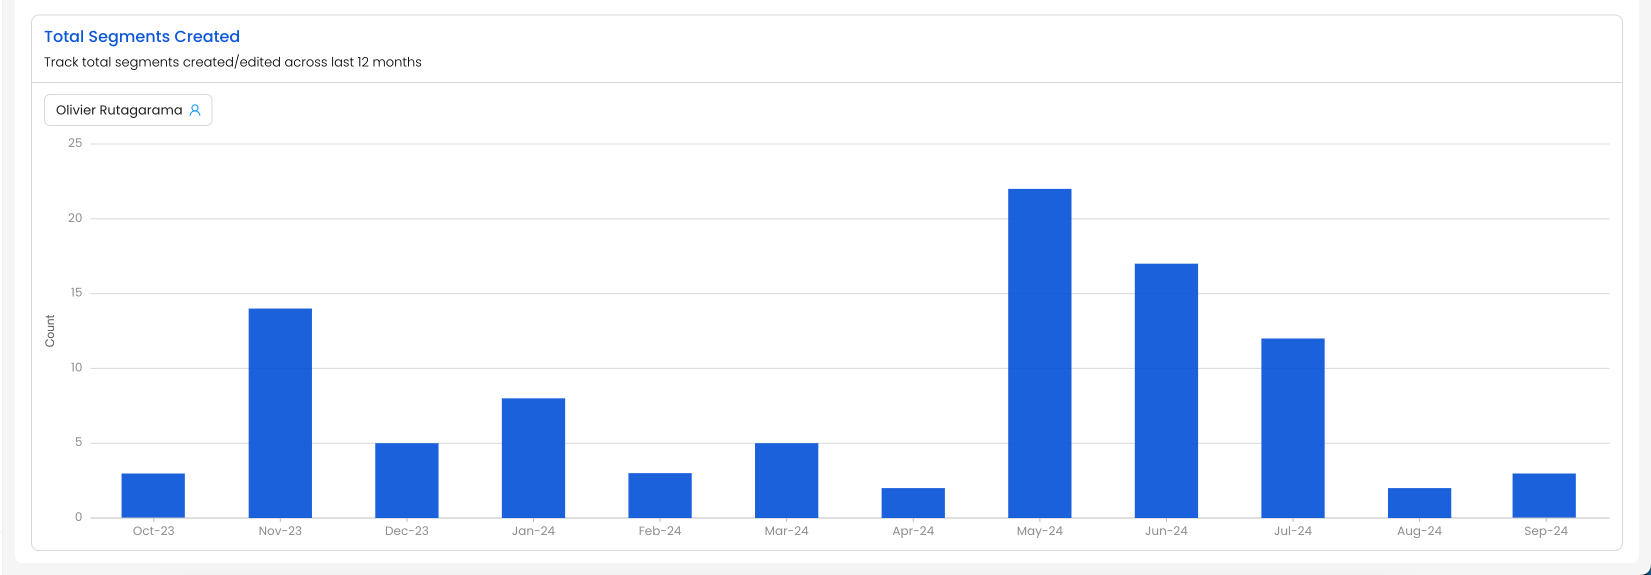
3. Total Segments Created: Track total segments created/edited across last 12 months either for individual users or all users combined.
4. Total Accounts Viewed: You can see the total accounts viewed across last 12 months either for individual users or all users combined.
Last updated
Was this helpful?

